
How will the winter 2015/2016 be? Can you predict it accurately? For those of you who did not attended my brief introduction talk in the colloquium on October 8, 2015, here are the talk slides:
If you want to participate, here are the rules:
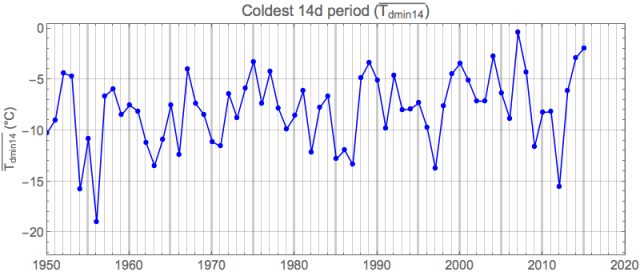
Metric 1: Coldest 2-week (14-days) mean daily minimum temperature
in meteorological winter: December 2015 – February 2016
A single cold night does not make a “cold winter” – hence a frost period of 2 weeks. A graph of the last 65 years of this metric is given below:
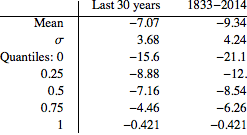
The statistics of this metric is shown in the histograms below, both for the last 30 years and also for the entire record of the Jena weather station since 1833 (minimum temperatures were recorded only from 1833).
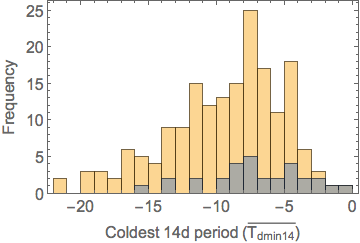
Statistics:
If you want to play with the data for improving your statistical forecast, you can download the daily mean, max and min temperatures from the Jena weather station here. The data displayed above in the graph of T_dmin14 are available as a text file (cvs) here.
Daily updates of how Metric 1 develops during this winter are displayed here.
Interestingly: the entries by challenge participants exhibit two clusters: a “warm” cluster around -1.5°C and a “cold” cluster around -5°C. Similar to the phases of the NAO…
Metric 2: Maximum 10-minute CO2 concentration measured on institute roof and minimum of lowermost 5% quantile of daily 10′ CO2 measurements during the meteorological winter: December 2015 – February 2016.
Since we are a biogeochemical institute, Christian Rödenbeck suggested also a prediction of a biogeochemical quantity. This metric contains two numbers. A graph of these numbers for the winters since measurements began is shown below, as well as a table of the numbers. The full suite of measurements is displayed and updated daily on Institute Roof CO2.
A typical winter day in CO2 mixing ratio (concentration) looks like this: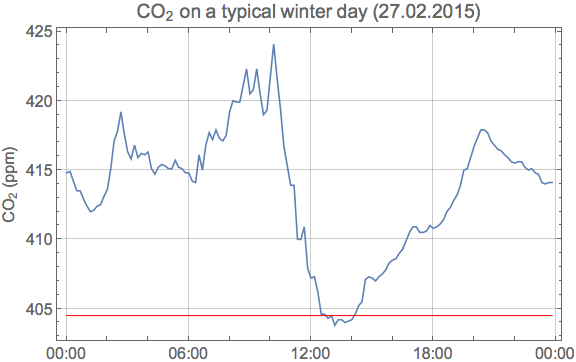 The maximum is reached in the morning under stable meteorological conditions, reflecting the build-up of local respiration and fossil CO2 sources. The minimum in the afternoon is caused by enhanced vertical mixing and presumably is close to mixed planetary boundary layer concentrations for this part of Europe.
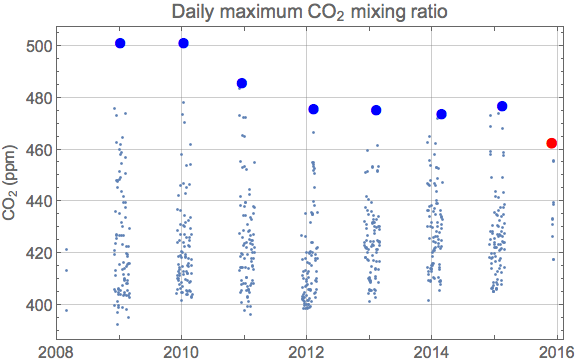
Daily maxima in winter time over the last seven years are shown below. The large symbols indicate the respective winter maximum, which is to be forecast for the winter 2015/2016. The red dot show the maximum recorded so far in December 2015.
(Addendum: found some spikes in the time series which are clearly artefacts. They were removed by applying a 30′-median running average. Indeed, the maximum in 2009 shown below is an artefact. The all-time maximum recorded in 2010 is however a real CO2 peak.)
Daily lowermost 5% quantile values (C_0.05) of the 10′ measurements are displayed below, together with monthly values from Mauna Loa.
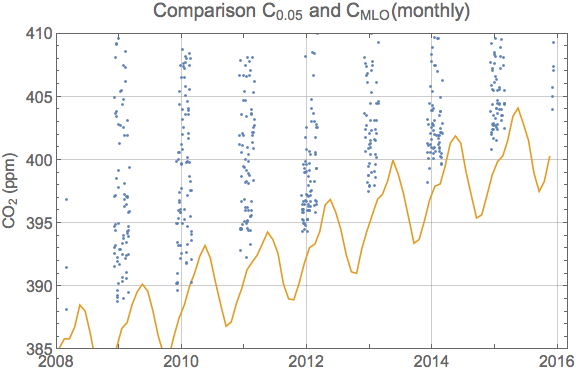
The lowermost C_0.05 values closely follow the MLO time series with an offset of about 2-4 ppm. The histogram of the difference to the MLO curve shows a sharp edge on the left hand side:
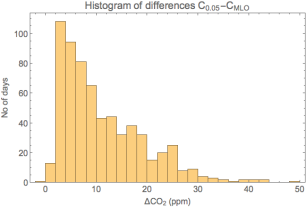 Thus forecasting C_0.05 for the winter of 2015/2016 could be based forecasting MLO and the offset…
Daily updates of how Metrics 2 develop during this winter are displayed here.
Entries:
Your entry must contain:
- Names of the team members
- Estimation method (1 to a few paragraphs explaining how you came to your prediction). Everything is permitted: Secret phone call to your grandfather, website, fancy statistical estimate, GCM simulation, horoscope etc. But document it!
- Challenge entry: Your prediction either for Metric 1 or Metric 2 or for both.
Send your entry to me by email for now. I will then make a life website showing the entries and the actual development as the winter proceeds. A link to the life website will be added here.
Deadline: December 15, 2015, 23:59 CET
A bit longer than originally planned. Gives you an opportunity to watch the first two weeks of the winter before sending in your forecast…
Prize: a bottle of good wine for the winners of each metric challenge
Feel free to comment on this challenge – use the comment link below.

Half way through winter: Ernst-Detlef Schulze leads the 14 day average minimum temperature challenge. However a further cold spell might change things. The CO2 prediction challenge is probably already decided, with Christian Rödenbeck as lead: It would require another very calm night in order to exceed the maximum of 488ppm attained on on Jan 7. The minimum of the lowermost 5% quantile was already decided on December 1 (403.9 ppm), later values tend to be higher because of the rising seasonal cycle reaching its maximum in spring.
LikeLike