How was the summer 2016? Here are the results.
Note: This post update contains additional information regarding the temperature offsets between Jena city (Schillergässchen) and the institute weather station. Temperature maxima are 1.66°C higher in the city than at the institute; likewise temperature minima are 1.06°C higher in the city than at the institute. The statistics shown in the post of June 19, 2016 were calculated with the “city” temperatures (in order to compare them with the climatology or the long-term time series). However, the metrics as given clearly refer to the “institute weather station”… The info given below corrects for this difference where appropriate.
Metric 1: Maximum temperature recorded and the number of “tropical nights”
Temperatures recorded every 10′ on the institute roof during the summer of 2016 are shown in Figure 1. The maximum was recorded at 34.35°C on June 24, 2016 at 15:20 (red dot).
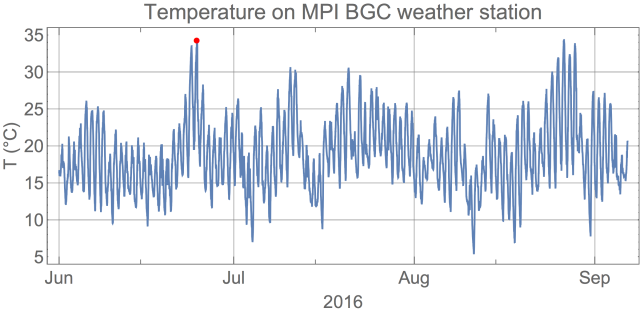
Figure 1. Temperatures recorded at the MPI BGC weather station in summer of 2016.
There was no tropical night in 2016. The updated graph of tropical nights in recent years is shown in Figure 2. Note that this is calculated with the institute temperature values; if they were corrected to the city values, there would have been two tropical nights: on June 23/24, and on August 27/28.
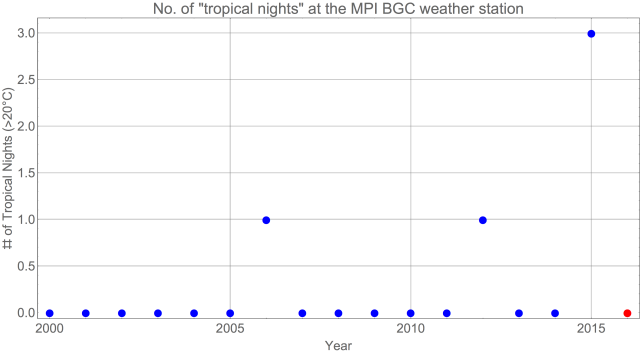 Figure 2: Number of tropical nights in summer in Jena.
The maximum temperature recorded on the institute roof on June 24, 2016 corresponds to a temperature in the city of 36.01°C. This is lower than last year, when an all-time record of 38.94° was recorded. It is close to the expected trend of the summer maxima (0.023°/yr) over the last 150 years.

Figure 3: Maximum summer temperatures recorded in Jena since 1820. The value for 2016 is indicated with the red circle. Data prior to 2003 are from the old weather station in the Schillergässchen. Data after 2003 are based on the institute roof weather station corrected for the mean offset between the two stations.
A view of the daily summer temperatures in Jena is provided in Figure 4. The summer was characterised by two heat waves: one in late June and one in late August. In both, maxima exceeded more than 2 sigmas above the climate normal (1961-1990).
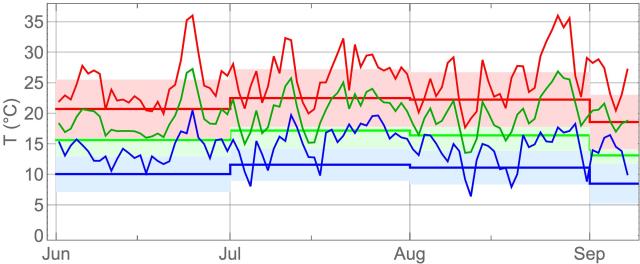
Figure 4. Daily temperatures recorded in 2016 in Jena (city temperatures). Solid lines: Minima (blue), mean (green), maxima (red). The horizontal straight lines and the shaded areas show the statistical expectation (mean and 1-sigma) for the three summer months based on the reference period 1961-1990.
Compared to the climate normal (1961-1990) the summer of 2016 was substantially warmer. The distribution of the daily temperatures (mean, min, max) are shown in Figure 5 and compared to the climate normal. The mean was 2.36° warmer.

Figure 5: Histograms of daily temperatures in summer (June-August), for the climatology (1961-1990, green) and as observed in 2016 (red).
The entire year of 2016 was very dry compared to the climate normal (Figure 6). Monthly precipitation sums reached the median of the climate normal only in February, May and July. In all the other months, the precipitation sum was lying in the lowermost quartile of the climate normal. Notice however, that the climate normal was computed from the observations at the Schillergässchen station, while the data for 2016 were from the MPI BGC weather station. It is possible that there is a systematic bias between the two sites.
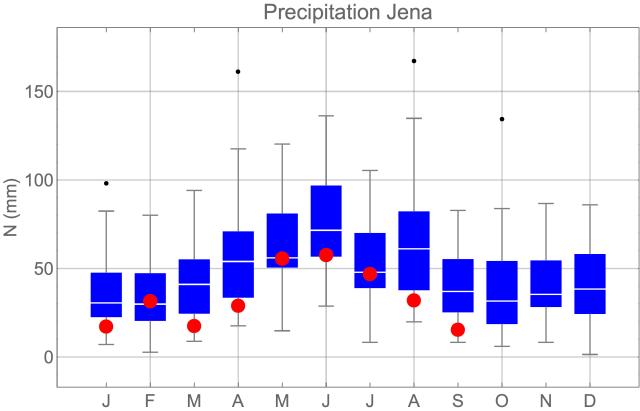
Figure 6: Box-whisker plot (blue) of the monthly precipitation sums computed from the climate normal (1961-1990). Red circles denote monthly precipitation sums recorded at the MPI BGC weather station.
Metric 2: Minimum of the 15-day median of the daily lowermost 5% quantile of the recorded CO2 concentration
The 15-day median of the recorded daily lowermost 5% quantile of the CO2 concentration at the institute weather station follows pretty much the minimum monthly temperature recorded at Mauna Loa (Figure 7, 8).
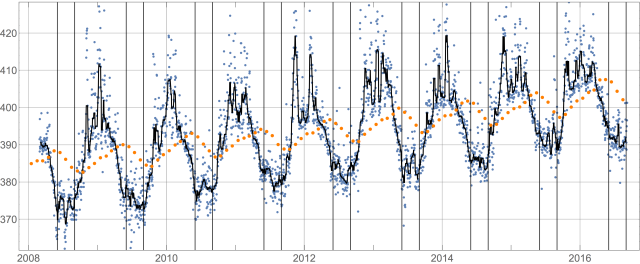
Figure 7: Daily lowermost 5% quantile of the CO2 concentration recorded at the institute weather station (blue dots). Black line: 15-day median. Orange dots: monthly CO2 concentration measurements at the Mauna Loa observatory. The vertical black lines delineate the 3 summer months in each year.
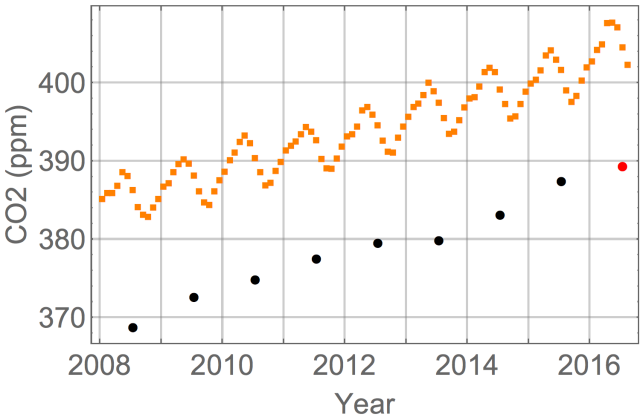
Figure 8: Minimum of the 15-day median of the daily lowermost 5% quantile of the CO2 concentration on the institute roof (black circles). Orange squares: monthly CO2 concentration measured at the Mauna Loa station.
The minimum 15-day median in 2016 was 389.4 ppm.
